


Hioki SF1001 Power Logger Viewer
Use our chat for technical support or contact us via +45 31 33 18 19 or salg@GOmeasure.dk
- Analyze and Graph Logged Energy Data Captured by Hioki Clamp On Power Loggers on a Windows PC
Discover the possibilities
More information
Description
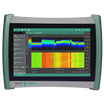
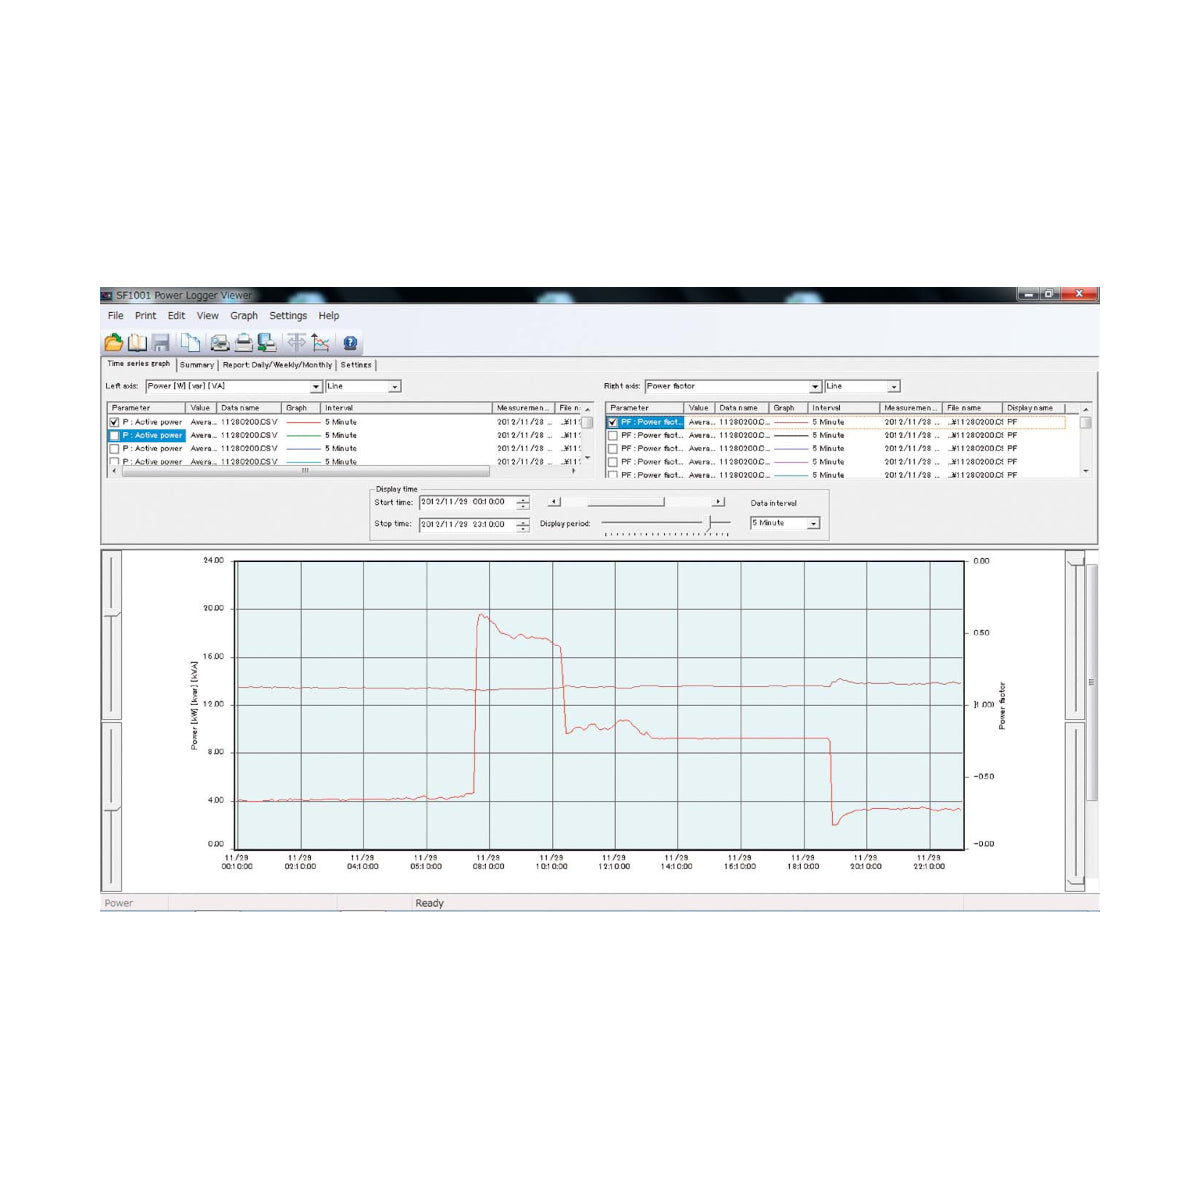
Hioki portable power meters and power analyzers are best in class power measuring instruments for measuring single to three-phase lines with a high degree of precision and accuracy. The SF1001 is a software application for graphing measurement data captured with the PW3360/3365 series, 3169 series Clamp On Power Loggers using a computer.
Key Features
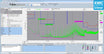
- Trend graph display
- Summary, daily, weekly, and monthly reports
- Report printing
Collect data that reflects changes in multiple locations and compare to gain an understanding of the big picture
- Group power consumption data for multiple locations together and display on a single graph so that you can readily identify the times and locations that are characterized by high power consumption.
- Choose a line graph or bar graph depending on your purpose.
- Consolidate up to 16 sets of data into a single file so that it can be loaded more quickly.
Display data for measurements made at different times on a single graph
Functionality for changing the date associated with a set of data lets you change the time of data to facilitate comparison so that you can identify the benefits of energy-saving measures at a glance.
Specifications
Basic specifications
| Read-compatible model | PW3360 series, PW3365 series, 3169 series | |||||
|---|---|---|---|---|---|---|
| Supported computer OS | Computer running under Windows 10 (32bit/64bit), Windows 8/8.1 (32bit/64bit), Windows 7 SP1 or later (32bit/64bit) | |||||
| Trend graph display function | [Display item] Voltage, current, active power, reactive power, apparent power, power factor, frequency, integrated active power, integrated reactive power, demand volume, demand value, voltage disequilibrium factor, Pulse, Harmonics (level, content, phase angle, total value, THD) [Stacked bar graph display] Up to 16 types of data series can be displayed in an overlay graph [cursor measurements] Measurement values can be displayed by the cursor | |||||
| Summary Display Function | Displayed items are the same as for Trend Graph Display [Daily, weekly and monthly report displays]: Accumulates and displays daily, weekly and monthly reports over specified period. [Load factor calculation display]: Calculates and displays load factor and demand factor results with daily, weekly and monthly reports [Time span aggregation]: Aggregates data into up to four specified time spans | |||||
| Waveform display | Displays waveform data at specified data | |||||
| Harmonic display | [List display]: Displays a list of harmonic data at specified date [Graph display]: Displays a bar graph of harmonic data at specified date [Cursor calculation]: Calculates measurement data at cursors in waveform and graph displays | |||||
| Copy function | Captures any display image to the clipboard | |||||
| Print Function | Preview and print content shown on the trend graph, report, harmonic graph and settings displays. [Comment entry]: (Text comments can be entered in any printout) [Header/Footer settings]: Sets the header and footer for each printout [Printing support]: Any color or monochrome printing supported by the operating system | |||||
| Report printing | Print (static) contents over a specific time period [Output contents]: Standard or selected output items [Available output items]: Trend graph, summary, daily report, harmonic list, harmonic graph, waveform [Report creation method]: Standard print [Report output settings]: Save/load report output settings | |||||
Documents
Options
Video
Hioki portable power meters and power analyzers are best in class power measuring instruments for measuring single to three-phase lines with a high degree of precision and accuracy. The SF1001 is a software application for graphing measurement data captured with the PW3360/3365 series, 3169 series Clamp On Power Loggers using a computer.
Key Features
- Trend graph display
- Summary, daily, weekly, and monthly reports
- Report printing
Collect data that reflects changes in multiple locations and compare to gain an understanding of the big picture
- Group power consumption data for multiple locations together and display on a single graph so that you can readily identify the times and locations that are characterized by high power consumption.
- Choose a line graph or bar graph depending on your purpose.
- Consolidate up to 16 sets of data into a single file so that it can be loaded more quickly.
Display data for measurements made at different times on a single graph
Functionality for changing the date associated with a set of data lets you change the time of data to facilitate comparison so that you can identify the benefits of energy-saving measures at a glance.
Basic specifications
| Read-compatible model | PW3360 series, PW3365 series, 3169 series | |||||
|---|---|---|---|---|---|---|
| Supported computer OS | Computer running under Windows 10 (32bit/64bit), Windows 8/8.1 (32bit/64bit), Windows 7 SP1 or later (32bit/64bit) | |||||
| Trend graph display function | [Display item] Voltage, current, active power, reactive power, apparent power, power factor, frequency, integrated active power, integrated reactive power, demand volume, demand value, voltage disequilibrium factor, Pulse, Harmonics (level, content, phase angle, total value, THD) [Stacked bar graph display] Up to 16 types of data series can be displayed in an overlay graph [cursor measurements] Measurement values can be displayed by the cursor | |||||
| Summary Display Function | Displayed items are the same as for Trend Graph Display [Daily, weekly and monthly report displays]: Accumulates and displays daily, weekly and monthly reports over specified period. [Load factor calculation display]: Calculates and displays load factor and demand factor results with daily, weekly and monthly reports [Time span aggregation]: Aggregates data into up to four specified time spans | |||||
| Waveform display | Displays waveform data at specified data | |||||
| Harmonic display | [List display]: Displays a list of harmonic data at specified date [Graph display]: Displays a bar graph of harmonic data at specified date [Cursor calculation]: Calculates measurement data at cursors in waveform and graph displays | |||||
| Copy function | Captures any display image to the clipboard | |||||
| Print Function | Preview and print content shown on the trend graph, report, harmonic graph and settings displays. [Comment entry]: (Text comments can be entered in any printout) [Header/Footer settings]: Sets the header and footer for each printout [Printing support]: Any color or monochrome printing supported by the operating system | |||||
| Report printing | Print (static) contents over a specific time period [Output contents]: Standard or selected output items [Available output items]: Trend graph, summary, daily report, harmonic list, harmonic graph, waveform [Report creation method]: Standard print [Report output settings]: Save/load report output settings | |||||