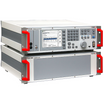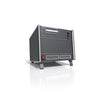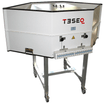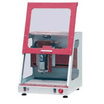
Detectus HRE 2 EMC Scanner
Use our chat for technical support or contact us via +45 31 33 18 19 or salg@GOmeasure.dk
Discover the possibilities
More information
Description
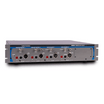
Detectus HRE 2 EMC Scanner
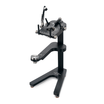
Using the EMC-Scanner during the early stages of design enables you to detect potential emission problems before they become integrated into the product and expensive to correct. If a product has failed a test at a test house, normally you only know which frequency failed. You don’t get to know the location of the source. The EMC-Scanner can help you find the source and repeated measurements while redesigning your product helps you lower the emission levels.
The EMC-Scanner can help you maintain a high quality in the production line. You can make measurements on samples from the production line and easily compare them with a reference. That way you can make sure that, for example, a change of supplier for a component doesn't affect the emission spectra in a negative way.
HRE 2
Measurable volume: 280x180x85 mm
Movement in XYZ-axis: 280x180x85 mm
Visual Noise Detection
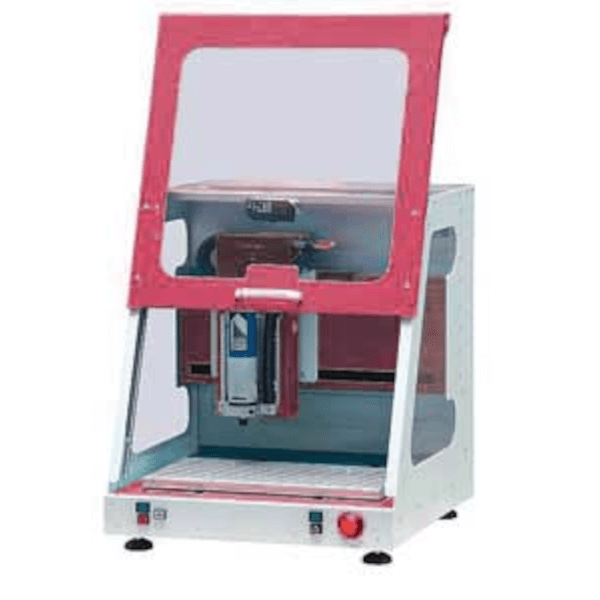
The patented EMC-scanner measures the emission from PCB’s, components, cables and products. The system consists of an X-Y-Z robot, a spectrum analyzer with near field probe and a standard PC with custom software and a GPIB card or similar for communicating with the spectrum analyzer. During measurement the near field probe is moved by the robot to a grid of measuring points above the test object. At each measuring point the location of the probe and the value of the emission intensity is stored in the computer. After the measurement the results can be documented in different types of reports.
Calibrate to beacon
![]()
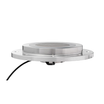
The scanner tables of the HRE-series scanners are equipped with beacons for automatic and accurate probe calibration.
Calibrating to the electric center point of probe helps you reproduce high quality measurement results every time.

Objective comparative measurements
One of the most useful features of the EMC Scanner system is that it enables you to make truly objective comparative measurements.
To the left, you can see an example of comparative measurements. The six measurements show the same test object and the same frequency. The difference is the value of the de-coupling capacitor of one IC.
MultiScan

The MultiScan measurement enables you to generate field plots from any frequency within the measured wide band span. This powerful feature is a major improvement and it gives an enormous amount of information. Looking at the screen dump to the right, the main part of the screen shows the field plot of the frequency selected in the top left graph. The top left graph shows the accumulated trace (a max hold spectra of all measuring points). The top right graph shows the wide band spectra from a user selectable spot on the field plot.

Import 3D surface models
Now you can import 3D surface models in STL file format and create measuring points that follow the surface at a fixed distance. 3D surface models can easily be aligned to the measurement using the 3-point alignment feature
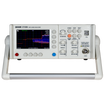
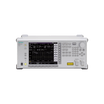
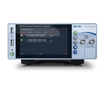
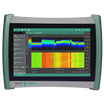
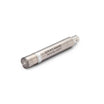
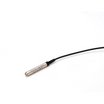
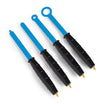
The HRE-Scanner comes with a set of four specially selected near field probes, a 30 dB pre-amplifier and two RF cables. To complete the Scanner system you would need a PC and a spectrum analyzer. Depending on your choice of spectrum analyzer you may also need an GPIB adapter (it only works with adapters from National Instruments).
The probe kit includes:
RF-E 03 E-Field 30MHz-3GHz
RF-B 0,3-3 Vert. H-field, 30MHz-3GHz
RF-R 0,3-3 Horiz. H-field, 30MHz-3GHz
LF-B 3 Vert. H-field, 9kHz-50MHz
The pre-amplifier kit includes:
PA 303
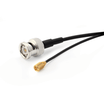
RF cables (RG 316U) 
Specifications
Documents
Options
Video
Detectus HRE 2 EMC Scanner
Using the EMC-Scanner during the early stages of design enables you to detect potential emission problems before they become integrated into the product and expensive to correct. If a product has failed a test at a test house, normally you only know which frequency failed. You don’t get to know the location of the source. The EMC-Scanner can help you find the source and repeated measurements while redesigning your product helps you lower the emission levels.
The EMC-Scanner can help you maintain a high quality in the production line. You can make measurements on samples from the production line and easily compare them with a reference. That way you can make sure that, for example, a change of supplier for a component doesn't affect the emission spectra in a negative way.
HRE 2
Measurable volume: 280x180x85 mm
Movement in XYZ-axis: 280x180x85 mm
Visual Noise Detection
The patented EMC-scanner measures the emission from PCB’s, components, cables and products. The system consists of an X-Y-Z robot, a spectrum analyzer with near field probe and a standard PC with custom software and a GPIB card or similar for communicating with the spectrum analyzer. During measurement the near field probe is moved by the robot to a grid of measuring points above the test object. At each measuring point the location of the probe and the value of the emission intensity is stored in the computer. After the measurement the results can be documented in different types of reports.
Calibrate to beacon
![]()
The scanner tables of the HRE-series scanners are equipped with beacons for automatic and accurate probe calibration.
Calibrating to the electric center point of probe helps you reproduce high quality measurement results every time.

Objective comparative measurements
One of the most useful features of the EMC Scanner system is that it enables you to make truly objective comparative measurements.
To the left, you can see an example of comparative measurements. The six measurements show the same test object and the same frequency. The difference is the value of the de-coupling capacitor of one IC.
MultiScan

The MultiScan measurement enables you to generate field plots from any frequency within the measured wide band span. This powerful feature is a major improvement and it gives an enormous amount of information. Looking at the screen dump to the right, the main part of the screen shows the field plot of the frequency selected in the top left graph. The top left graph shows the accumulated trace (a max hold spectra of all measuring points). The top right graph shows the wide band spectra from a user selectable spot on the field plot.

Import 3D surface models
Now you can import 3D surface models in STL file format and create measuring points that follow the surface at a fixed distance. 3D surface models can easily be aligned to the measurement using the 3-point alignment feature
The HRE-Scanner comes with a set of four specially selected near field probes, a 30 dB pre-amplifier and two RF cables. To complete the Scanner system you would need a PC and a spectrum analyzer. Depending on your choice of spectrum analyzer you may also need an GPIB adapter (it only works with adapters from National Instruments).
The probe kit includes:
RF-E 03 E-Field 30MHz-3GHz
RF-B 0,3-3 Vert. H-field, 30MHz-3GHz
RF-R 0,3-3 Horiz. H-field, 30MHz-3GHz
LF-B 3 Vert. H-field, 9kHz-50MHz
The pre-amplifier kit includes:
PA 303
RF cables (RG 316U) 

